Research note 02
Same Model, Ten Harnesses
Three benchmarks, ten coding harnesses, one result three times over — hold the model constant, change only the scaffold, and the bill moves 3.8x, 2.8x, and in Solvency's own measurements 9.1x.
- Published
- 2026-08-26
- Prices verified
- 2026-08-21
- Sources
- OpenBench · WildClawBench · Solvency Bench
- Method
- usage × price · source-measured · first-party
Every table in this note is re-derived from the datasets by the test suite.
Same Model, Ten Harnesses
Three benchmarks that have never met, ten coding harnesses between them, the same result three times. OpenBench ran GPT-5.6 Sol through four harnesses and published the token usage; Solvency repriced it at verified API rates. WildClawBench (InternLM) held four models constant across four scaffolds, including Hermes Agent and OpenClaw. And on 2026-08-26 Solvency ran the measurement itself: the same GPT-5.6 Sol through eight arms of its own benchmark — Pi, Aider, Codex, Goose, OpenCode, Cline, Hermes Agent, and a bare API call as the no-scaffold control. Three populations, reported separately below, never sharing a table; together they cover ten distinct harnesses.
This revision replaces the earlier editions at this URL (“Same Model, Four Harnesses”, 2026-08-23; “Six Harnesses”, earlier 2026-08-26). Nothing in the earlier tables changed; a first-party population and the technical groundwork joined them.
What a harness actually is
The word gets used as if it were packaging. It is closer to the drivetrain. Addy Osmani’s Agent Harness Engineering gives the cleanest formulation: Agent = Model + Harness — the harness being everything wrapped around the raw model that turns next-token prediction into finished work. Concretely, five subsystems wear the one name:
- A context assembler — system prompt, project instructions, skill files, repo maps: what the model gets to see, and how many tokens seeing it costs.
- A tool broker — file reads and writes, shell, search, MCP servers: what the model gets to do, and the round-trips each action spends.
- An execution sandbox — where model-written code actually runs, and what damage it cannot do there.
- A verification loop — tests, typechecks, hooks; in Osmani’s phrase, “success is silent, failures are verbose”: failure output is recycled into the next attempt.
- A cache manager — which parts of the context are rebuilt each call, and which are re-read at the provider’s cached-input discount.
Every one of those subsystems is also a line item. That is this note’s subject: the same model’s bill, with only the drivetrain changed.
The short version
Hold the model constant. Hold the task set constant. Change the harness, and the bill moves — in three benchmarks, independently.
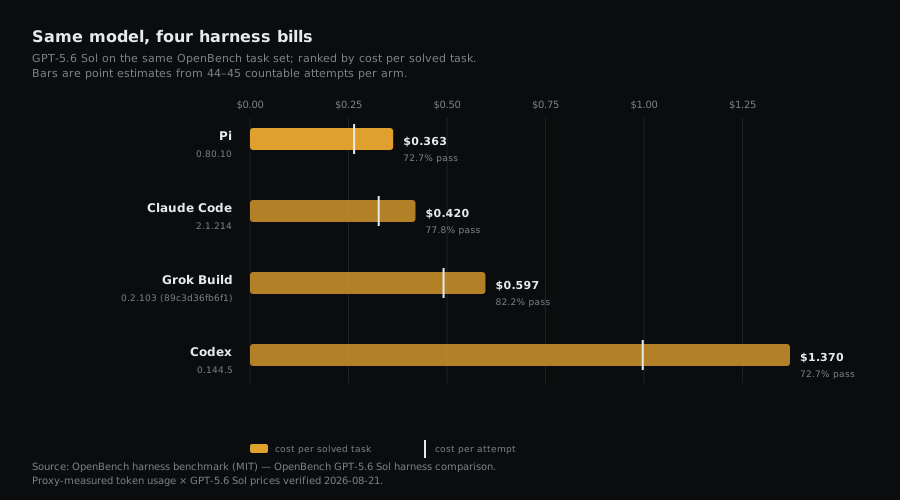
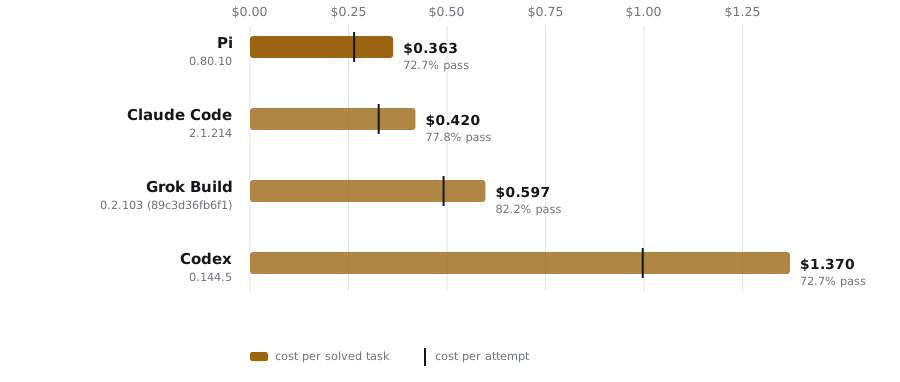
- OpenBench (15 tasks, GPT-5.6 Sol): cost per solved task moves from $0.363 with Pi to $1.370 with Codex — a 3.77x spread at the same 72.7% pass rate.
- WildClawBench (60 different tasks, four models): cost per score-equivalent task moves by 1.9x to 2.8x within each model, and the harness that scores best is never the one that bills least.
- Solvency Bench (12 single-turn tasks, GPT-5.6 Sol, run by Solvency): every arm scores 100%, and the bill still spans 9.1x — from Aider’s $0.0093 per solved task to Cline’s $0.0851, with Pi (OpenBench’s cheapest arm on its own population) at $0.0097. With correctness held perfectly equal, what remains is the pure price of the scaffold.
This is not a finding that any harness is universally better. It is a finding that the harness changes the bill, even when the name in the model column does not. A useful cost planner therefore has to price the whole agent architecture—not just the foundation model.
Population one — OpenBench: GPT-5.6 Sol through four harnesses
| Harness | Version | Solved | Pass | $ / attempt | $ / solved | vs Pi |
|---|---|---|---|---|---|---|
| Pi | 0.80.10 | 32/44 | 72.7% | $0.264 | $0.363 | 1.00x |
| Claude Code | 2.1.214 | 35/45 | 77.8% | $0.327 | $0.420 | 1.16x |
| Grok Build | 0.2.103 (89c3d36fb6f1) | 37/45 | 82.2% | $0.491 | $0.597 | 1.64x |
| Codex | 0.144.5 | 32/44 | 72.7% | $0.997 | $1.370 | 3.77x |
Source: OpenBench harness benchmark (MIT), verified 2026-08-23 against the release’s digest-sealed raw results and provenance.
What the dollar figures are
OpenBench did not publish a metered dollar bill. It published complete proxy-measured input, cache-read and output token totals for these four arms. Solvency divides each total by the arm’s countable attempts and applies the current GPT-5.6 Sol rates:
| Token class | Price / million | Verified |
|---|---|---|
| Uncached input | $5.00 | 2026-08-21 |
| Cached input read | $0.50 | 2026-08-21 |
| Output | $30.00 | 2026-08-21 |
We label this basis source usage repriced. No Solvency task tier, loop count, cache-hit assumption, retry cap or frontier-efficiency multiplier is inside these values.
Finding 1 — A matched pass rate, a 3.77x bill
Pi and Codex each solved 32 of 44 countable attempts: 72.7%. The success denominator is therefore identical. Their cost difference comes entirely from the observed token mix.
| Harness | Uncached input / attempt | Cache read / attempt | Output / attempt |
|---|---|---|---|
| Pi | 24,086 | 81,024 | 3,442 |
| Codex | 64,828 | 769,419 | 9,593 |
Codex read roughly 9.5x as many cached tokens per attempt, consumed 2.7x as many uncached input tokens, and produced 2.8x as many output tokens in this release. Cheap cache reads softened the dollar impact; they did not erase it.
The model price card cannot reveal this difference. Both rows say GPT-5.6 Sol. The usage pattern belongs to the model-harness system.
Finding 2 — The cheapest attempt was also the cheapest solve
Pi has the lowest point estimate both per attempt and per solved task. Grok Build has the highest pass-rate point estimate—82.2%—but its higher token usage leaves it 64% more expensive per solved task than Pi.
That does not establish a statistically decisive correctness ranking. With only 44 or 45 countable attempts per arm, the correctness intervals are wide. It does establish the accounting fact behind each point estimate: modest success-rate differences can be outweighed by large differences in the number and kind of tokens a harness consumes.
Population two — WildClawBench: four models, each through four harnesses
WildClawBench (InternLM, arXiv:2605.10912, MIT, first published 2026-05-11, verified 2026-08-26) runs 60 human-authored, long-horizon tasks — a completely different population from OpenBench’s 15 — inside a reproducible Docker container, and grades with deterministic checks, an environment-state audit and an LLM/VLM judge. Its harness-comparison leaderboard holds each of four models constant and varies the scaffold across OpenClaw, Claude Code, Codex CLI and Hermes Agent.
Two definitions before the numbers. Score here is a graded 0–100 average that can award partial credit; it is not a strict pass rate, so this table says score-equivalent task, never solved task. Cost is the per-task average in USD as computed and published by InternLM at the prices they paid — Solvency cannot reprice these arms because their per-cell token usage is not published. The dollars are the source’s, dated by its paper, not by our price card.
| Model | Harness | $ / task | Score | min / task | $ / score-eq task | vs cheapest |
|---|---|---|---|---|---|---|
| GPT-5.4 | OpenClaw | $0.33 | 50.3 | 5.83 | $0.656 | 1.00x |
| GPT-5.4 | Claude Code | $0.61 | 48.4 | 9.07 | $1.260 | 1.92x |
| GPT-5.4 | Codex CLI | $0.57 | 56.8 | 7.16 | $1.004 | 1.53x |
| GPT-5.4 | Hermes Agent | $0.44 | 50.7 | 8.97 | $0.868 | 1.32x |
| GLM 5 | OpenClaw | $0.19 | 42.6 | 6.22 | $0.446 | 1.33x |
| GLM 5 | Claude Code | $0.21 | 31.0 | 10.18 | $0.677 | 2.03x |
| GLM 5 | Codex CLI | $0.13 | 38.9 | 7.84 | $0.334 | 1.00x |
| GLM 5 | Hermes Agent | $0.44 | 46.4 | 6.62 | $0.948 | 2.84x |
| MiMo V2 Pro | OpenClaw | $0.44 | 40.2 | 7.63 | $1.095 | 2.58x |
| MiMo V2 Pro | Claude Code | $0.15 | 29.9 | 9.90 | $0.502 | 1.18x |
| MiMo V2 Pro | Codex CLI | $0.15 | 35.3 | 6.44 | $0.425 | 1.00x |
| MiMo V2 Pro | Hermes Agent | $0.26 | 48.1 | 8.30 | $0.541 | 1.27x |
| MiniMax M2.7 | OpenClaw | $0.12 | 33.8 | 9.18 | $0.355 | 2.12x |
| MiniMax M2.7 | Claude Code | $0.09 | 32.0 | 10.08 | $0.281 | 1.68x |
| MiniMax M2.7 | Codex CLI | $0.06 | 35.8 | 8.66 | $0.168 | 1.00x |
| MiniMax M2.7 | Hermes Agent | $0.11 | 37.1 | 10.30 | $0.296 | 1.77x |
Dataset: data/harness-study/wildclawbench.json. Scaffold builds are recorded by the source
as Docker image tags (wildclawbench-ubuntu:v1.3, wildclawbench-claudecode-ubuntu:v0.2,
wildclawbench-codex-ubuntu:v0.0, wildclawbench-hermes-agent:v0.5), not harness CLI
versions — a provenance gap stated here rather than papered over. This table is a
WildClawBench-only group: per the comparability rule it is never merged with population one,
the general leaderboard, or any other task population.
Finding 3 — The harness effect replicates on an independent task set
Population one showed a 3.77x per-solved spread on one model and 15 tasks. Population two shows, on 60 unrelated tasks: within each of four models, changing only the scaffold moves the score by up to 15.4 points (GLM 5: 31.0 under Claude Code, 46.4 under Hermes Agent) and the cost per score-equivalent task by 1.9x to 2.8x. Two benchmarks, two task populations, two grading schemes — one conclusion. The harness is a first-class pricing variable.
Finding 4 — The best score is never the cheapest score
In population two, Hermes Agent has the top score on three of the four models (GLM 5, MiMo V2 Pro, MiniMax M2.7) — and is not the cheapest per score-equivalent task for any of them. On GLM 5 it is the most expensive: $0.948, against Codex CLI’s $0.334 at 7.5 points less. Whether that trade is worth it depends on what a failed task costs you — which is exactly the question a cost planner should put in front of you, not answer for you.
The flip side: the cheapest harness per score-equivalent task is Codex CLI for three models and OpenClaw for GPT-5.4. There is no universal winner to name, and this note names none.
Finding 5 — OpenClaw’s number is an orchestration layer’s number
OpenClaw is a coordinator that delegates the coding turn to a registered harness plugin rather than an independent execution engine. Its cells therefore measure OpenClaw’s orchestration layered on its bundled delegate, not a fifth engine built from scratch. That is not a defect — the orchestration tax is real money and worth measuring — but reading its rows as apples-to-apples with a directly-driven CLI would overstate what was compared. The same caution applies to any stack that wraps one harness in another.
Population three — Solvency Bench: the harness tax, isolated
On 2026-08-26 Solvency stopped repricing other people’s runs and ran its own: the same GPT-5.6 Sol through eight arms of Solvency Bench’s single-turn suite — 12 code tasks, deterministic hidden-test graders, 3 trials, temperature 0. A bare API call is the control; every other arm is a real harness driving the same prompts, including Pi — the arm OpenBench’s own population crowns cheapest. Dollars are the harness’s own token accounting priced at verified catalog rates (the subscription arm’s flat fee never enters the math; cache writes price at the uncached input rate, stated).
| Arm | Version | Access | Pass | $ / solved task | vs cheapest |
|---|---|---|---|---|---|
| Aider | aider 0.86.2 | metered (OpenRouter) | 100% | $0.0093 | 1.00x |
| API, no harness | — | metered, single call | 100% | $0.0095 | 1.01x |
| Pi | 0.84.3 | metered (OpenRouter) | 100% | $0.0097 | 1.04x |
| Codex | codex-cli 0.150.0 | local subscription | 100% | $0.0248 | 2.65x |
| Goose | 1.47.0 | metered (OpenRouter) | 100% | $0.0284 | 3.05x |
| OpenCode | 1.18.20 | metered (OpenRouter) | 100% | $0.0364 | 3.90x |
| Hermes Agent | Hermes Agent v0.20.5 (2026.8.19) | metered (OpenRouter) | 100% | $0.0717 | 7.68x |
| Cline | 3.0.60 | metered (OpenRouter) | 100% | $0.0851 | 9.12x |
Dataset: data/harness-study/solvency-bench-v0.json; per-attempt journals under bench/results/.
Every arm passed every countable attempt, so pass rate explains none of this spread. The
anatomy does — median tokens per attempt, from the harnesses’ own accounting:
| Arm | Fresh input | Cache reads | Cache writes | Output |
|---|---|---|---|---|
| API, no harness | 103 | 0 | 0 | 288 |
| Aider | 752 | 0 | 0 | 166 |
| Pi | 3 | 1,192 | 0 | 206.5 |
| Codex | 528 | 15,104 | 0 | 214 |
| Goose | 3,282.5 | 3,169 | 0 | 349.5 |
| OpenCode | 3 | 0 | 6,106 | 171 |
| Hermes Agent | 3 | 0 | 12,682 | 249 |
| Cline | 8,394 | 4,904.5 | 0 | 1,144.5 |
Finding 6 — A lean harness can be free. A heavy one is a choice.
Aider’s whole scaffold is ~750 tokens — and its tighter output discipline (166 median output tokens against the bare call’s 288) more than pays for it: the harness arm comes in under no-harness-at-all. Overhead is not a law of nature; it is a design budget, and it can be negative.
At the other end, Cline runs a full iterating agent on every one-shot call — a median 8.4k fresh input tokens, 1.1k of output across its reasoning-and-submit loop — and Hermes carries a ~12.7k-token scaffold into every session. On a 100-token task that is a two-orders-of-magnitude context multiplier before any work happens. Nothing about that is wrong — those scaffolds buy skills, memory and tool surface on real agentic work — but on a bounded single call they are pure tax, and now it has a price: 9.1x.
Finding 7 — Cache strategy beats scaffold size
Codex and Hermes carry scaffolds of similar magnitude (~15k vs ~12.7k tokens). Codex bills $0.0248 per solved task; Hermes $0.0717. The difference is a single column in the anatomy table: Codex’s scaffold arrives as cache reads — billed at GPT-5.6 Sol’s $0.50/M cached rate — while Hermes’s arrives as cache writes, billed here at the full $5/M input rate. Same order of context, 2.9x apart on price, decided entirely by whether the harness re-reads its context at the discount or rebuilds it at list.
Pi makes the same point from the light end: a ~1.2k-token scaffold arriving almost entirely as cache reads leaves it 4% over the bare call — the OpenBench population’s cheapest arm rides nearly free on ours too, and for the same reason: small context, read at the discount. Goose sits mid-pack the same way from the other side: a ~3.3k scaffold, roughly half re-read at the cached rate. This is the cache manager (subsystem five) earning its keep, and it is invisible on every pricing page in the industry.
Why use a harness at all, then?
Because there are two regimes, and the single-turn suite deliberately lives in the one where harnesses can only lose. A bounded, self-contained call has nothing for the scaffold to do: no files to navigate, no tests to run, no failures to recycle. Overhead multiplies the bill; nothing divides it.
Real software work is the other regime. Cost per solved task is attempt cost ÷ pass rate — the scaffold’s overhead multiplies the numerator, but its verification loop works on
the denominator, and the denominator is where the leverage is. On Solvency’s agentic suite,
the reference tool loop read repos, edited files, ran tests and recycled failures to a
13-for-13 record at $0.0011–$0.002 per solved task on a value model; a bare single call
cannot run a test at all, so on execution-verified work its effective pass rate — and with
it, cost per solved task — falls off a cliff. The population-two data says the same thing
about scale: scaffold choice moved graded scores by up to 15.4 points on identical models.
Osmani’s engineering claim — “a decent model with a great harness beats a great model with a bad harness” — is the capability half. The economics half, measured above: the harness decides both what a task costs and whether it gets solved at all; pick its weight to match the work. Ship a bounded transform through a lean scaffold or none; ship real repo work through a harness whose verification loop and cache discipline you have priced.
The harnesses, feature by feature
First-hand observations from running each arm (2026-08-26 builds), plus each project’s documentation — capability notes, not endorsements:
| Claude Code | Codex | Pi | Goose | Cline | Hermes Agent | OpenCode | Aider | solvency-loop | |
|---|---|---|---|---|---|---|---|---|---|
| Models | Anthropic (login/key) | OpenAI (login/key) | any (provider/model) | any (15+ providers) | any (provider registry) | any (multiplexer) | any (provider/model) | any (LiteLLM-style) | any (OpenRouter) |
| Headless one-shot | -p --output-format json | exec --json | -p --mode json | run -t (+recipes) | -y --json | -z --usage-file | run --format json | --message | library call |
| Machine-readable usage | full incl. cache r/w | full incl. cache r/w | full incl. cache r/w + cost | session store (SQLite) | full incl. cache r/w + cost | full incl. reasoning | per-step tokens+cost | tokens line (k-rounded ≥1k) | API usage object |
| Cache behavior observed | heavy reads | heavy reads | small scaffold, read back | mixed read/write | heavy fresh input + writes | writes each session | writes each session | none (lean prompt) | none |
| Agentic tool loop | yes | yes | yes (extensible) | yes (MCP/extensions) | yes (submit-gated) | yes | yes | edit-focused | minimal by design |
| Execution sandboxing | policy/hooks | sandbox modes | extension-defined | tool permission modes | approval model (-y bypasses) | egress controls | permission prompts | none (git-scoped) | docker, network-less |
Finding 8 — A build calculator needs roles, not one model picker
Modern agent systems can route different work to different models. The Hermes Agent documentation describes isolated subagents and support for multiple model providers; its delegation configuration can assign a different, cheaper model to subagents. A realistic plan might use Claude Fable 5 as an orchestrator and lower-priced models for parallel workers.
The correct unit to price is a call graph:
role_cost = expected_invocations
          × (fresh_input × input_price
             + cached_input × cache_read_price
             + output × output_price)

cost_per_build_attempt = harness_overhead + sum(role_cost)
Fallbacks and retries add their expected cost explicitly. For example, a fallback contributes
P(primary failure) × fallback cost. Solvency should always report cost per attempted build
and monthly spend. It should report cost per completed build only when the user supplies
or Solvency measures an end-to-end system success rate.
Individual model benchmark scores cannot be averaged or multiplied into a credible composed success rate. Until the system is measured, the honest result is: success rate not supplied.
Price your own architecture: Open the Build Composer. Enter any public, internal or custom harness, then mix orchestrator, worker and fallback models role by role.
What this report cannot tell you
- It is one release. The four arms cover 15 admission-gated tasks and 44–45 countable attempts each. They demonstrate a harness effect; they do not estimate its universal size.
- It is a point-estimate cost comparison. Wide correctness intervals prevent strong claims about the middle of the pass-rate ranking.
- The dollars are a reprice, not a subscription invoice. OpenBench used subscription-backed GPT-5.6 Sol access. Solvency applies API token rates so the usage has a common dollar basis.
- Pi is provisional. OpenBench flagged Pi for a rerun after a surprising per-task swing.
- The exclusions matter. Cursor and OpenCode are absent because their tokens were CLI-self-reported rather than proxy-measured. Devin is absent because its split usage was incomplete. Including them would mix measurement bases.
- It says nothing about arbitrary stacks. A Hermes + Fable + worker-model plan is a user-modelled architecture until traces or a controlled benchmark measure that exact system.
- Population two’s dollars cannot be repriced or dated to a run day. WildClawBench does not publish per-cell token usage for the harness-comparison arms, states no run dates for that table (the paper’s 2026-05-11 v1 is the only anchor), and states no trial counts. Its cost figures are the source’s own computation at the prices it paid.
- Population two’s score is not a pass rate. It is a graded 0–100 average with partial credit and an LLM/VLM judge in the loop. That is why its derived column is cost per score-equivalent task and is never called cost per solved task, and why the two populations cannot be ranked against each other.
- Population three is single-turn by construction. It isolates scaffold overhead by removing every task where a scaffold could help; it says nothing about these harnesses’ agentic quality, and its 12-task size is a smoke-signal tier (±27pp worst-case CI on any pass-rate claim — moot here at 36/36 per arm, stated anyway).
- Population three’s dollars are usage repriced at catalog list rates. The Codex arm ran
on a subscription login (basis
subscription_usage_repriced— precedent: population one); metered arms ran via OpenRouter. Cache writes price at the uncached input rate; vendors’ write premiums are not modeled. - Aider’s token counts are its own rounded reporting (k-rounded above 1,000), recorded as reported.
- Grok Build is still unmeasured by Solvency. It appears only in population one (OpenBench’s usage, repriced); adding it first-party needs xAI-side access not yet in place. The ten-harness union is complete; the first-party arm set is not.
- The Cline arm is graded from files. Its first run was invalidated as an adapter artifact (the agent narrates in text and writes code to the workspace; reply-fence extraction under-scored it 50%) and rerun with file-based grading — the same precedent as Aider. Both runs’ journals are retained.
- The two Claude Code rows are not the same Claude Code. Population one pins CLI 2.1.214; population two records a Docker image tag from a different build line, months apart. Even the shared harness name does not license a cross-population comparison.
Methodology
For every admitted harness arm:
cost_per_attempt =
  (uncached_input_total / countable_attempts) × $5 / 1,000,000
  + (cache_read_total / countable_attempts) × $0.50 / 1,000,000
  + (output_total / countable_attempts) × $30 / 1,000,000

cost_per_solved_task = cost_per_attempt / (solved / countable_attempts)
The source’s infrastructure and rate-limited failures remain excluded exactly as its methodology specifies. The four harness rows are isolated from Solvency’s general model leaderboard and are never compared across benchmark populations.
For every WildClawBench cell (population two):
cost_per_score_equivalent_task = cost_usd_per_task / (score_pct / 100)
with cost_usd_per_task and score_pct transcribed verbatim from the source’s published
harness-comparison table into data/harness-study/wildclawbench.json. The “vs cheapest”
multiplier compares within one model’s four cells only.
For every Solvency Bench arm (population three):
cost_per_attempt = (fresh_in × in_rate + cache_read × cached_rate
                    + cache_write × in_rate + output × out_rate) / 1e6
cost_per_solved_task = mean(cost_per_attempt) ÷ pass_rate
with usage from each harness’s own accounting and rates from the verified catalog
(solvency-bench-v0, journals in bench/results/, study file in
data/harness-study/solvency-bench-v0.json).
node bench/runner.mjs --selftest      # verify every grader, free
node bench/runner.mjs --model openai/gpt-5.6-sol --harness aider --trials 3
Reproduce this
The table and chart regenerate from the repository’s canonical data:
npm test
npm run charts
npm run charts:light
node scripts/render-pdf.ts reports/2026-08-same-model-four-harnesses.md
The report tests parse every published row in both populations. Population one re-derives its
pass rate, per-attempt cost, per-solved cost and relative multiplier through the same engine
used by the website; population two re-derives every score-equivalent figure and multiplier
from data/harness-study/wildclawbench.json. OpenBench source data was verified 2026-08-23;
WildClawBench was verified 2026-08-26; GPT-5.6 Sol API prices were verified 2026-08-21, so no
source or price appears fresher than it is.